Combined form deviation and roughness measurement
The surface quality of raw products is crucial to guaranteeing that products will work perfectly later on. Metallic implants in dentistry, for instance, require a particularly low level of roughness. In contrast, many raw products depend on a particular level of roughness for subsequent painting and coating processes. Some applications even call for concurrent information about form deviation and roughness.
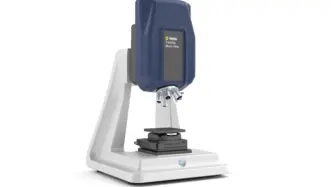
Learn about the versatility of TopMap optical surface metrology and the multi-sensor profiler TopMap Pro.Surf+ for detailed surface topography analysis. The all-in-one optical sensor system analyzes samples quickly with a large field of view and without stitching. Precisely gather areal information in 3D regarding parameters like height and steps, parallelism plus roughness and texture.
Classification of form deviation and other surface components
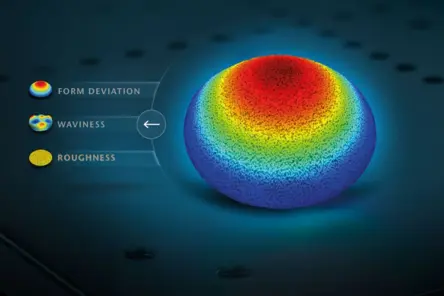
What's the difference between surface form, surface roughness and surface waviness? By conventional machining processes, three main components of surface topography are generated and they are classified according to their causes.
The first component are the roughness and textural details which are inherent in any production process, left by machining (e.g. cutting tool, spark), as a result of edge formation or tool tip irregularities.
The second component is the waviness which results from factors such as deflections, vibrations, unbalanced grinding wheel, irregularities in tool feed, chatter or extraneous influences.
The third surface component after roughness and waviness is the form or shape, characterizing the exact geometric properties with regard to the form tolerance values defined in technical drawings and designing.
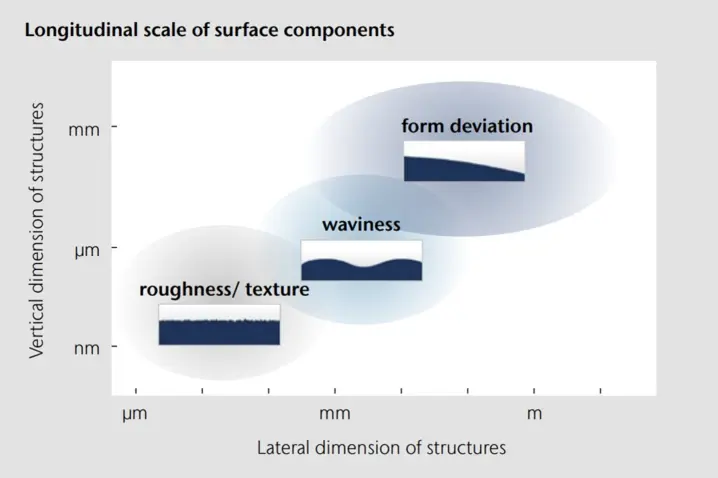
Form deviation vs roughness vs waviness
The scheme "classification of surface deviation" provides an overview of those surface components with respect to lateral and vertical dimensions. Left in this chart, see roughness and texture components, where detailed information in lateral and vertical dimensions is needed, as a popular evaluation parameter in surface metrology. And today the most common method to measure surface roughness is still stylus-based profilers with one of the known disadvantages of contact causing wear, leading to inconsistent measurements after a time.
Very often, a specific characteristic of a surface component is explicitly required to fulfill a certain functionality. However, incorrect operation of machining tools, improper fixation of the workpiece or distortion due to thermal stress can cause unwanted form deviations. Unbalanced operation and machine vibrations will appear as waviness on the surface, while machining processes and chip formation will lead to a characteristic surface roughness.

Download whitepaper
Form deviation, waviness or flatness, and roughness or texture are not sharply defined but rather defined close to each other. A surface can be described as a superposition of numerous wavelengths, where the transition within surface components from form (particularly long-wavelength) over waviness to short wavelength roughness components takes place smoothly. Read more in the surface roughness whitepaper.
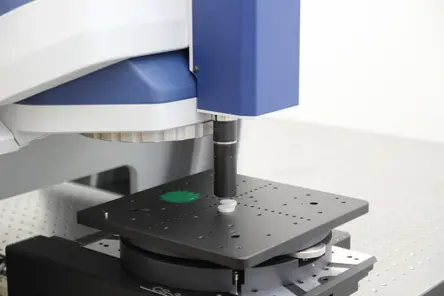
Fitting surface profiler for highest flexibility
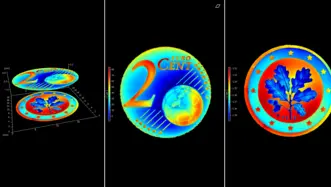
The TopMap models from Polytec allow both the large area determination of form deviation with nanometer resolution and a large measurement volume plus the measure of surface roughness on a smaller section. While whitelight interferometry allows areal surface inspection, the additional chromatic confocal sensor determines roughness profiles, too. Characterize entire workpiece surfaces, calculate volume and exactly determine peaks and valleys on behalf of the examined distance parameters.
Roughness Tester
The Roughness Tester is our entry Micro.View system and the most cost effective way to get started into the 3D surface roughness measurement. Step from R to S parameters.
Micro.View
TopMap Micro.View® is an easy to use optical profiler in a compact table-top setup. Choose Micro.View® as the cost-effective inspection tool for examining precision-engineered surfaces down to the sub-nm range, for inspecting roughness, microstructures and more surface details.
Micro.View+
Advanced microscope-based surface profiler with automation and color imaging. Micro.View+ enables repeatable, operator-independent roughness and texture analysis—ready for lab and production use.
Choose the right surface profiler with confidence—benefit from our "try before buy" approach.

Related measurement tasks & downloads
Surface roughness measurement
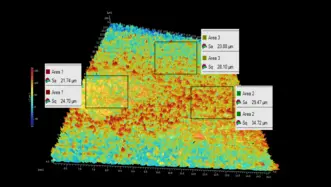
Surface texture analysis in 3D. From Sa/Sq to Str/Sal for validating specifications and surface features.
Maintain form and position tolerances
Verify form and position tolerances such as waviness, flatness, parallelism and tilt. Optical 3D surface metrology delivers reliable results—even in bores.
Flatness, thickness and parallelism
Flatness, thickness and parallelism (FTP) measurement combines top & bottom topography measurement in a single shot.
Coating Quality Control in 3D
Coating quality control in 3D. Assessing pre-coat texture, post-coat defects, and film thickness.
Tribology analysis
Tribology analysis with 3D surface profiler. Inspecting friction, wear and lubrication performance.
Pass/fail analysis
WLIs deliver fast, objective and easy-to-use pass/fail feedback from areal 3D data. Sub-nanometer Z resolution and recipe-driven workflows support inline SPC.
Surface metrology on microstructures
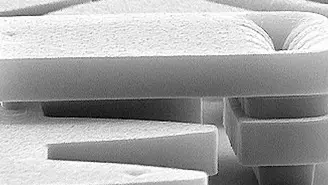
Topography & dynamics of microstructures and for nanotech. 3D geometry, roughness, and time-resolved motion.
Downloads
Discuss your demands with our experts
Let’s start with a short discussion about your parts, tolerances, and workflow—and, if useful, we can add a feasibility study, PolyMeasure (contract measurements), or a PolyRent trial as optional next steps.