Keeping layer thickness in specification
Consistent layer thickness across the process is critical to quality and yield. Coatings meet their design targets only when (1) the substrate is prepared to specification, (2) the coating surface is defect-free, and (3) thickness is maintained within tolerance.
Early problems often stem from substrate fabrication and preparation—machine instability, tool path errors, or stress-related deformation—leaving signatures that affect coating behavior. Post-machining, superfinishing and cleaning may be needed to remove residual defects and contamination.
Optical 3D surface metrology exposes functional geometric deviations and enables early, automated detection of surface quality shifts.
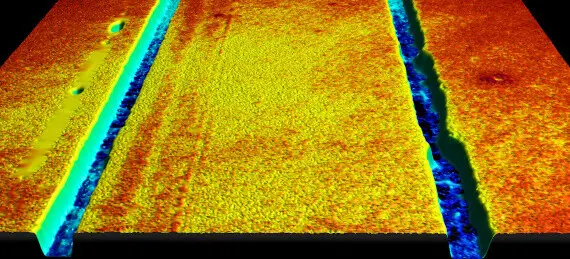
The thickness of coatings and layers is mostly conducted with a step-height surface measurement. More details about step-height measurement can be found here.
Pre-coating: verify substrate readiness
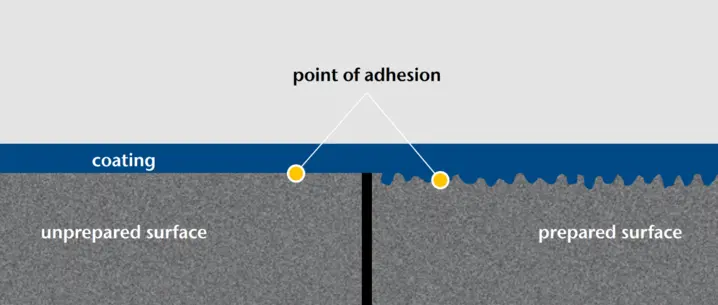
Before a surface is coated, it may need preparation tailored to its intended function. A shift in surface texture indicates process drift—adjust machining settings or replace tooling as needed. Keep in mind that substrate texture often telegraphs through the coating, affecting both final appearance and functional topography.
What to verify (areal, ISO 25178)
Select parameters relevant to adhesion, tribology and optical appearance:
- Height/roughness: Sa, Sq; shape: Ssk (skewness), Sku (kurtosis)
- Texture & layout: Str (texture aspect ratio), Sal / autocorrelation length
- For appearance-critical parts, track both areal (3D “S”) and any legacy profile (“R”) specs
Hint: Areal characterization is increasingly standard for complex surfaces.
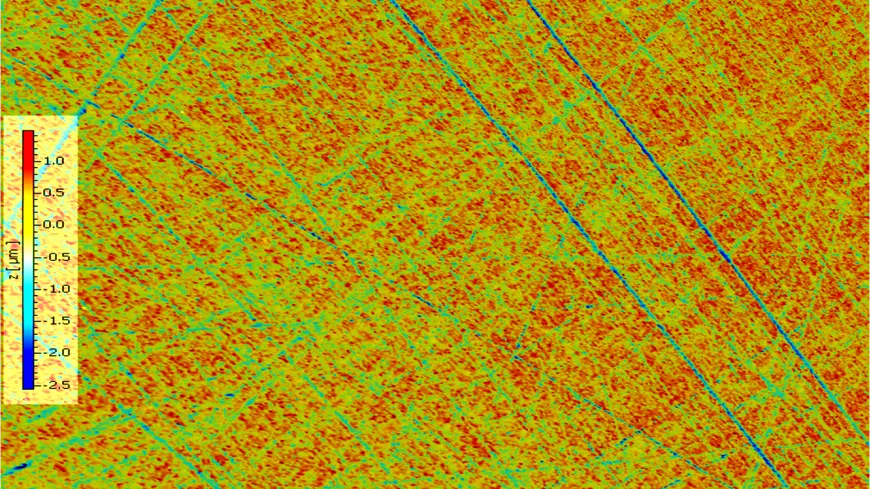
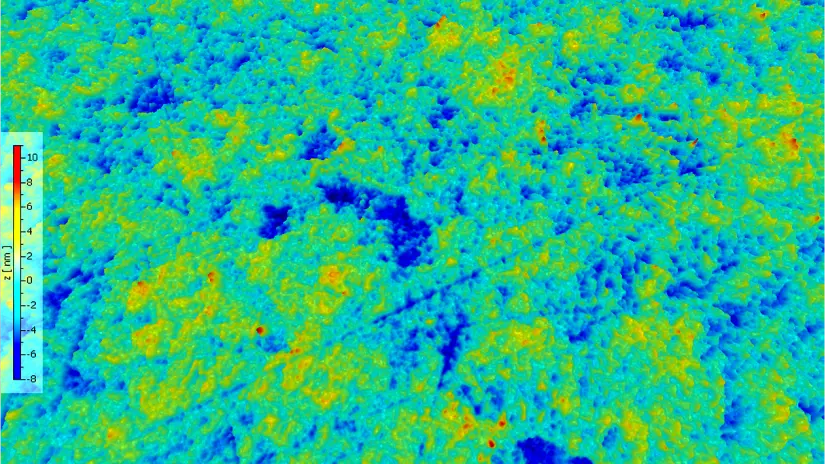
Below are two examples of polished and lapped surfaces where the areal roughness Sa and Sq are evaluated.
Free webinar "Roughness measurement made easy"
Access this webinar when interested in line-based roughness (ISO 21920, Ra, Rq, Rz) or areal roughness measurement (ISO 25178, Sa, Sq, Sz) incl. tips & tricks, understanding and applying settings the right way, and bridging the gap from micro to macro: flatness & roughness all-in-one.

Post-coating: detect and classify surface defects
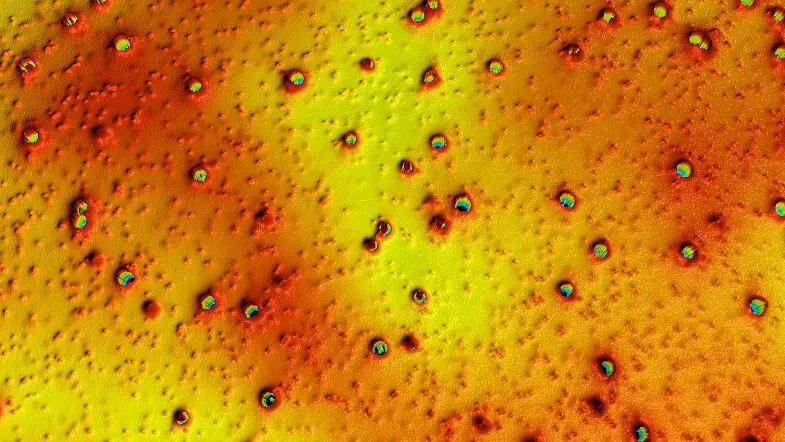
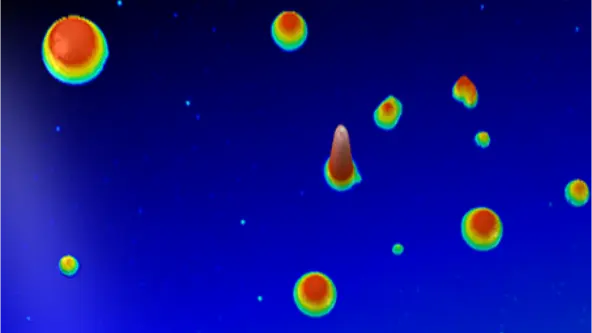
After application, ensure the coated surface is free of voids, streaks, droplets, spots, dimples, chatter, scratches, orange peel and other disturbances. Rapid, quantitative defect checks protect yield and enable quick process correction to minimize scrap.
- Defect presence & morphology — quantify height/depth, area, volume to link symptoms to root causes
- Areal “V” parameters (ISO 25178) — use void/material volume metrics to characterize pits, peaks and plateau regions for robust OK/NOK thresholds.
- Appearance-critical texture — verify that print-through or orange peel stays within limits; catalog typical signatures per line to speed troubleshooting.
Layer thickness validation
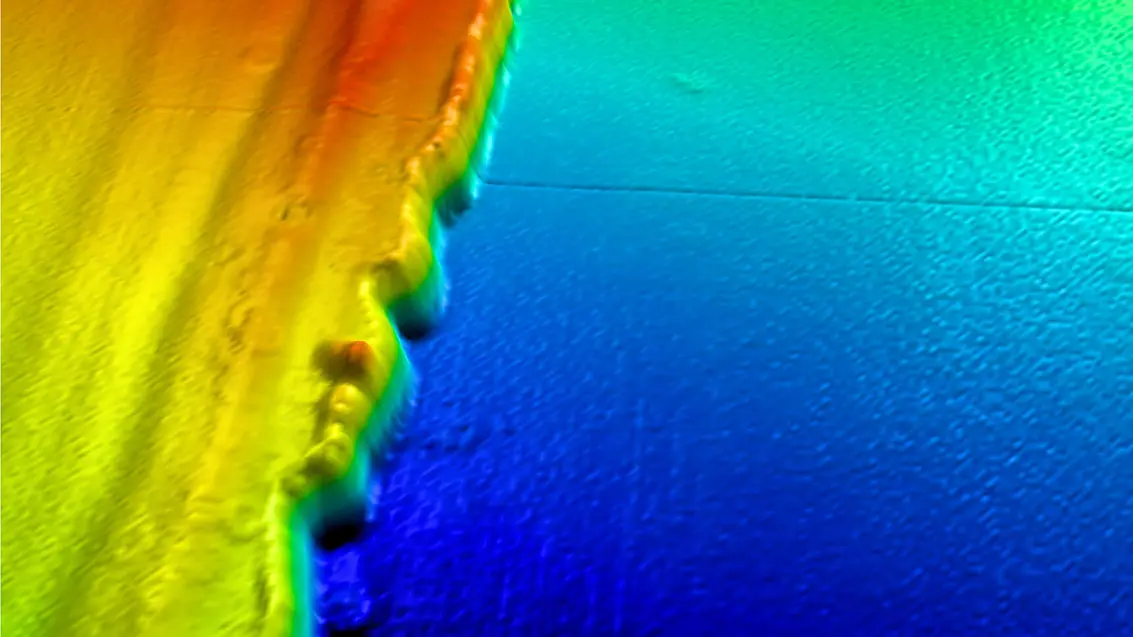
Control thickness at representative sites and features. Use step-edge measurements wherever a masked edge or edge break is available to get direct physical thickness, especially for opaque films. For transparent or semi-transparent coatings, measure through the film interferometrically and convert optical thickness using the correct refractive index.
Reserve the scratch test primarily for adhesion/critical-load QA; profiling the scratch can also yield a local step for thickness, but it’s not the general-purpose method. Map multiple positions to assess uniformity and adjust deposition or prep if drift appears.
More information on step-height measurement can be found here.
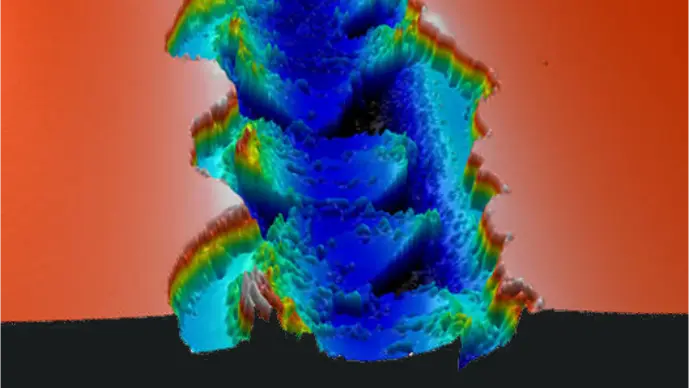
What features should a surface profiler for coating and thickness inspection have?
The #1 reason teams switch to TopMap CSI/WLI systems is flexibility: reliable measurements on everything from mirror-bright metals to very dark, ultra-matte surfaces—exactly the mix you see in coating lines. A capable profiler for coatings should offer:
- Wide material compatibility: High-dynamic-range optics/algorithms that keep fringe contrast on reflective ↔ matte surfaces without sprays or re-fixturing.
- Stable sub-nanometer Z-resolution: Low noise independent of magnification, with traceable calibration and repeatability suitable for GR&R.
- Thickness modes for all films: Step-edge workflows for opaque coatings, plus through-film thickness for transparent/semi-transparent layers with refractive-index handling (incl. multi-layer).
- Macro↔micro coverage: Large FOV for uniformity maps and fast screening, then zoom for micro-defects; stitched maps, telecentric optics, and tools to handle steep slopes/curved parts.
- Defect & surface analytics: Automated detection/sizing/classification, ISO 25178 areal “S” parameters and “V” volume metrics for objective pass/fail.
- Throughput & integration: Scripted multi-site recipes, autofocus, barcode/recipe control, OK/NOK rules, and easy export to SPC/QMS/PLC/MES.
- Shop-floor robustness: Environmental/vibration compensation and short cycle times for in-line/near-line use.
- Usability at scale: Guided workflows, templates, and audit trails so results are consistent across operators and shifts.
Our optical profilers for coating & thickness
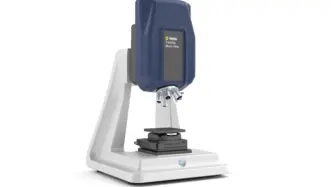
Micro.View
TopMap Micro.View® is an easy to use optical profiler in a compact table-top setup. Choose Micro.View® as the cost-effective inspection tool for examining precision-engineered surfaces down to the sub-nm range, for inspecting roughness, microstructures and more surface details.
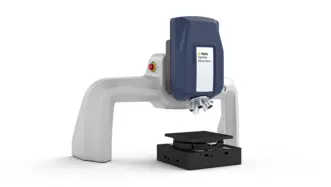
Micro.View+
Advanced microscope-based surface profiler with automation and color imaging. Micro.View+ enables repeatable, operator-independent roughness and texture analysis—ready for lab and production use.
Choose the right surface profiler with confidence—benefit from our "try before buy" approach.

Discuss your demands with our experts
Let’s start with a short discussion about your parts, tolerances, and workflow—and, if useful, we can add a feasibility study, PolyMeasure (contract measurements), or a PolyRent trial as optional next steps.