Tribology ensures performance and safety
- surface metrology provides the proof
When it comes to tribology — that is, the science of friction, lubrication and wear — surface properties play a very important role. These parameters can be controlled as desired by simply changing the surface. The perfect conditions for friction, lubrication performance and wear/abrasion resistance are heavily influenced by refined surfaces.
Thus, engineers test and specify critical surface to safeguard the intended performance and functionality. However, corresponding measuring instruments are needed for this, since only powerful surface measurement methods enable development of suitable components. As 3D optical surface profiler are becoming the standard, areal parameters are utilized for specifying and checking defined surfaces.

Measuring wear and abrasion
Wear affects product life, efficiency, safety, and appearance. The abrasion resistance is assessed during R&D to compare materials and coatings, during qualification to verify warranty life or regulatory targets, and in service to detect drifts that alter friction or accelerate failure. Quantifying wear volume and scar geometry provides objective evidence for optimizing coatings and confirming durability.
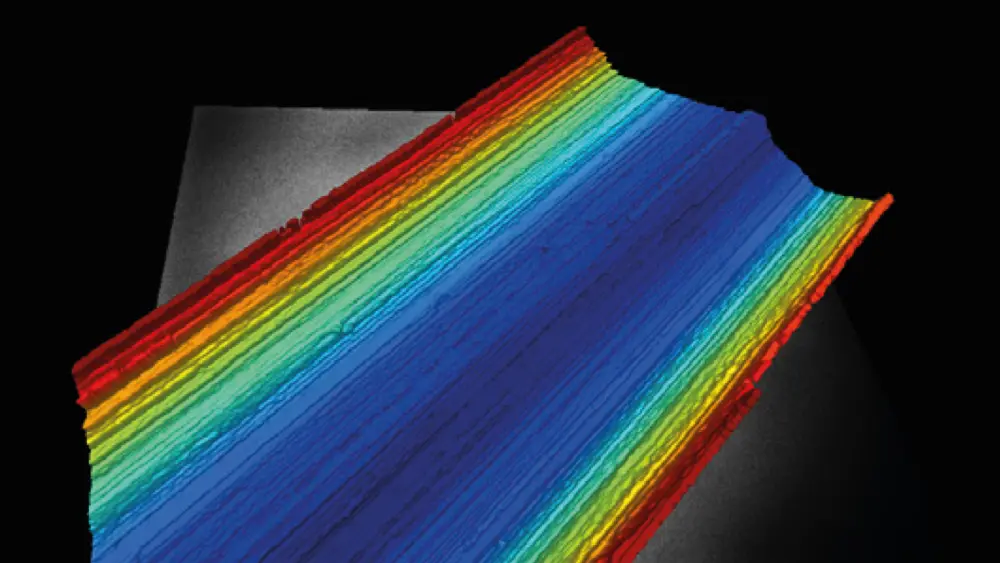
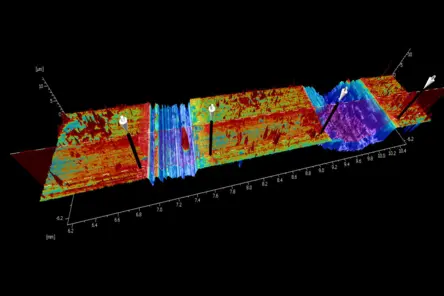
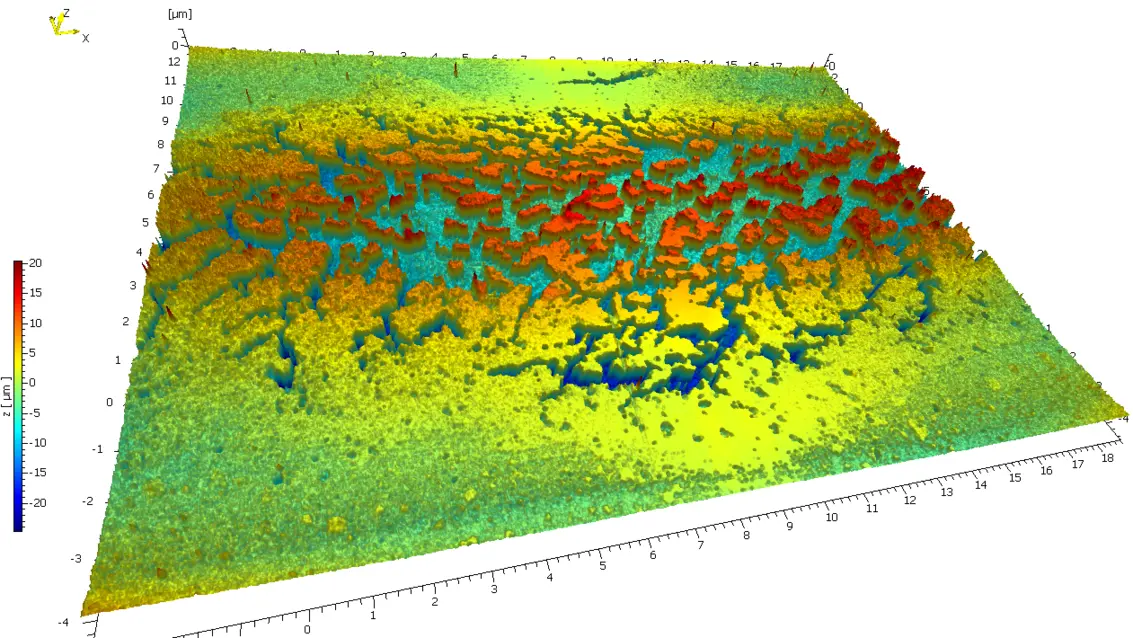
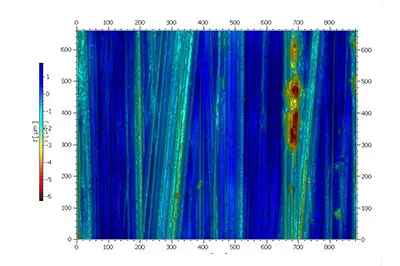
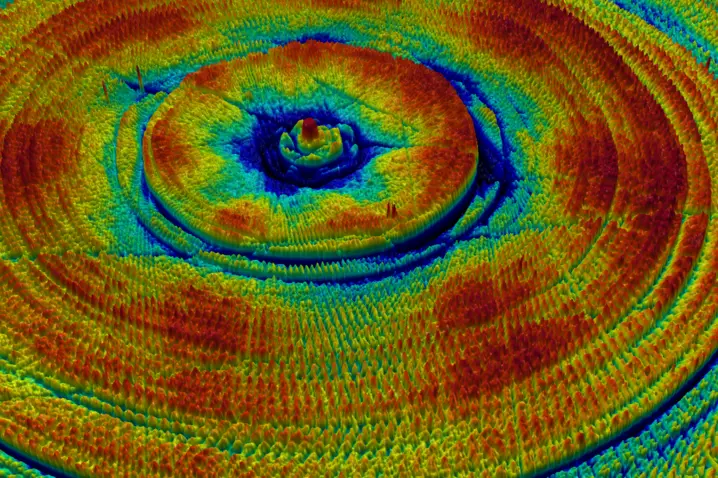
Use areal 3D metrology to capture the full wear footprint, then compute volume, depth, area, and morphology. ISO 25178 “V” parameters (e.g., Vv, Vm, Vvc, Vmc) are designed for volume-based characterization from the material ratio curve and are widely used for tribology. Large-area topography lets you see the whole scar, then remove form to isolate true wear and visualize coating breakdown (especially on curved parts like bearings).
From macro to micro: Scan a large FOV to reveal patterns (streaks, chatter) and then zoom for micro-damage — combine both in one workflow.
What is the difference between wear and tribology?
Wear is the material loss or surface damage that occurs during contact; tribology is the broader field studying the mechanisms behind that wear (and friction/lubrication) to predict and control it.
How is wear quantified?
Typically by 3D areal measurements of the wear scar (volume loss, maximum depth, affected area) and by derived parameters such as ISO 25178 S- and V-metrics. That is why optical profilometers are a perfect system for quality inspection.
How is a "standard" wear applied?
Especially for testing in R&D and selecting material or check production process, a standard "wear" has to be applied for comparable results. Common bench tests generate controlled contact, to apply the "scars" as:
- Pin-on-disk (ASTM G99): sliding wear under set load/speed; results often include wear rate and friction coefficient.
- Dry sand / rubber wheel (ASTM G65): abrasion ranking by volume loss (mm³) under standardized conditions.
- Taber abrasion (ASTM D4060): abrasion resistance of organic coatings on rigid panels
How to check lubrication feature of surfaces
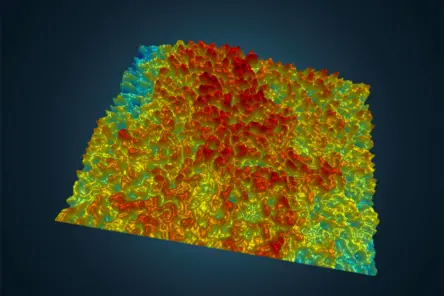
Engineers specify surface parameters to control lubrication performance. The texture influences how oil films form, how long they are sustained, and how effectively friction and wear are minimized. These specifications ensure that parts operate in the desired region of the Stribeck curve, avoiding excess heat, premature wear, or failure.
Parts are measured with surface profilers to confirm the texture matches the design intent and fulfil the design specifications. Inspection verifies that valleys, plateaus, and texture directionality provide the right balance of lubricant retention, load support, and controlled flow.
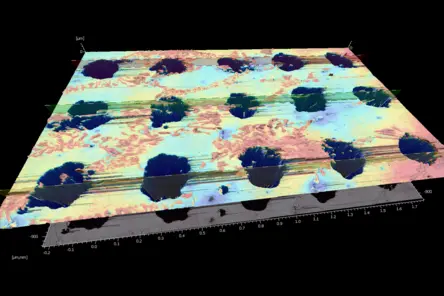
Confirm surface texture supports the intended lubrication regime. Use e.g. ISO 25178 areal metrics derived from the material-ratio curve to quantify oil retention and load support:
- Vvv/Vvc* (valley/void volumes) for lubricant capacity
- Vmp/Vmc (peak/core material volumes) for plateau integrity;
- Sk* family (Spk/Svk/Sk with Smr1/Smr2) for peak removal and valley reservoirs.
Directionality (Str/Sal) informs flow and shear behavior on textured surfaces.
Friction analysis with surface profilers
Friction coefficient (COF) trends reveal regime changes and impending failures: stable COF indicates adequate separation; rising or noisy COF suggests boundary contact, heat, and accelerated wear. Position on the Stribeck curve depends on viscosity, speed, load, and roughness, so COF should be interpreted with test conditions. Defect presence & morphology — quantify height/depth, area, volume to link symptoms to root causes
Record COF vs. time/cycles during standard tests (e.g., pin-on-disk, reciprocating). Correlate COF features (spikes, drift) with 3D scar metrics — volume loss, max depth, affected area — and with lubrication-related parameters (e.g., Vvv, Ssk/Sku for peak/valley propensity).
Validation for COF is basically a standard surface profiling analysis. The areal parameters specified by engineering has to be checked and documented. A standard job for our profilometers — even with highly reflective surfaces.
Fitting surface profiler for tribology measurement tasks
Roughness Tester
The Roughness Tester is our entry Micro.View system and the most cost effective way to get started into the 3D surface roughness measurement. Step from R to S parameters.
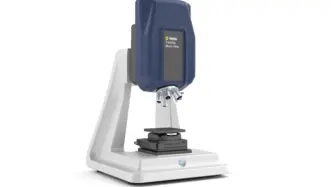
Micro.View
TopMap Micro.View® is an easy to use optical profiler in a compact table-top setup. Choose Micro.View® as the cost-effective inspection tool for examining precision-engineered surfaces down to the sub-nm range, for inspecting roughness, microstructures and more surface details.
Micro.View+
Advanced microscope-based surface profiler with automation and color imaging. Micro.View+ enables repeatable, operator-independent roughness and texture analysis—ready for lab and production use.
Choose the right surface profiler with confidence—benefit from our "try before buy" approach.

Why WLI surface profiler and why Polytec?
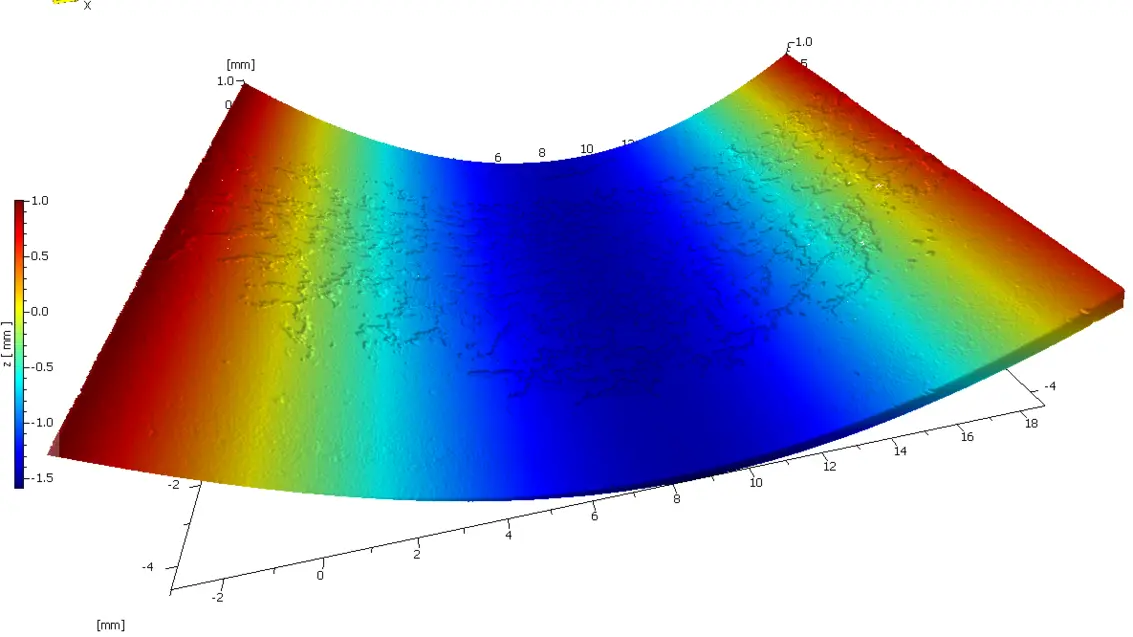
White-light interferometry (WLI/CSI) delivers traceable, areal 3D topography with sub-nanometer vertical noise over practical fields of view — ideal for quantifying wear scars, run-in, and lubricant-retaining textures. Tribology decisions depend on areal parameters (ISO 25178 S- and V-metrics) and on volume calculations after proper form removal; these require true 3D surface data rather than single profiles.
WLI captures the full scar or texture, then allows zoom-in to micro-features in the same workflow, enabling consistent calculation of wear volume, depth distributions, and valley capacities. Robust performance on reflective through ultra-matte surfaces and short measurement cycles further support qualification and SPC on production parts.
What are “S” parameters?
ISO 25178 S-parameters are areal (3D) surface texture descriptors such as Sa, Sq, Ssk, Sku, and spatial/directional terms like Str and Sal. They quantify height statistics and texture layout over an area, not just a profile line.
What are “V” parameters and when are they used?
V-parameters describe material/void volumes derived from the Abbott–Firestone (material-ratio) curve: Vmp, Vmc, Vvc, Vvv. They are especially useful for wear and lubrication because they quantify peak material (run-in), core support, and valley volume (oil retention).
Why use areal (3D) parameters instead of profile (2D) only?
Areal metrics capture the full contact footprint and texture anisotropy, improving correlation with functional behavior (friction, wear, lubrication) compared to single profiles. ISO 25178 defines these 3D parameters explicitly.
Why customers shift to Polytec profilers for tribology?
Especially at tribology evaluations we see challenging samples with highly reflective materials. This is a major reason that customer switch to Polytec´s TopMap CSI/WLI systems as they get reliable measurements on everything from mirror-bright metals to very dark, ultra-matte surfaces.
- Stable sub-nanometer Z-resolution: Low noise independent of magnification, with traceable calibration and repeatability suitable for GR&R.
- From macro↔micro coverage: Large FOV for uniformity maps and fast screening, then zoom for micro-defects; stitched maps, telecentric optics, and tools to handle steep slopes/curved parts.
- Defect & surface analytics: Automated detection/sizing/classification, ISO 25178 areal “S” parameters and “V” volume metrics for objective pass/fail.
- Throughput & integration: Scripted multi-site recipes, autofocus, barcode/recipe control, OK/NOK rules, and easy export to SPC/QMS/PLC/MES.
- Shop-floor robustness: Environmental/vibration compensation and short cycle times for in-line/near-line use.
- Usability at scale: Guided workflows, templates, and audit trails so results are consistent across operators and shifts.
Discuss your demands with our experts
Let’s start with a short discussion about your parts, tolerances, and workflow—and, if useful, we can add a feasibility study, PolyMeasure (contract measurements), or a PolyRent trial as optional next steps.